PETROLEUM QUALITY INSTITUTE OF AMERICA The Data Speak for Itself... Home About Us Methodology Contact Us |
||||||||
|
Consolidated 2016 SAE 0W-20 |
Click Bottles Below for
Data and Assessments |
|||||||
SAE 0W-20 TEST RESULTS ACTIVE API SERVICE CATEGORIES |
||||||||
|
Test Results for Passenger Car Motor Oils
CLICK BOTTLES FOR DETAILS |
 |
 |
 |
 |
 |
 |
 |
|
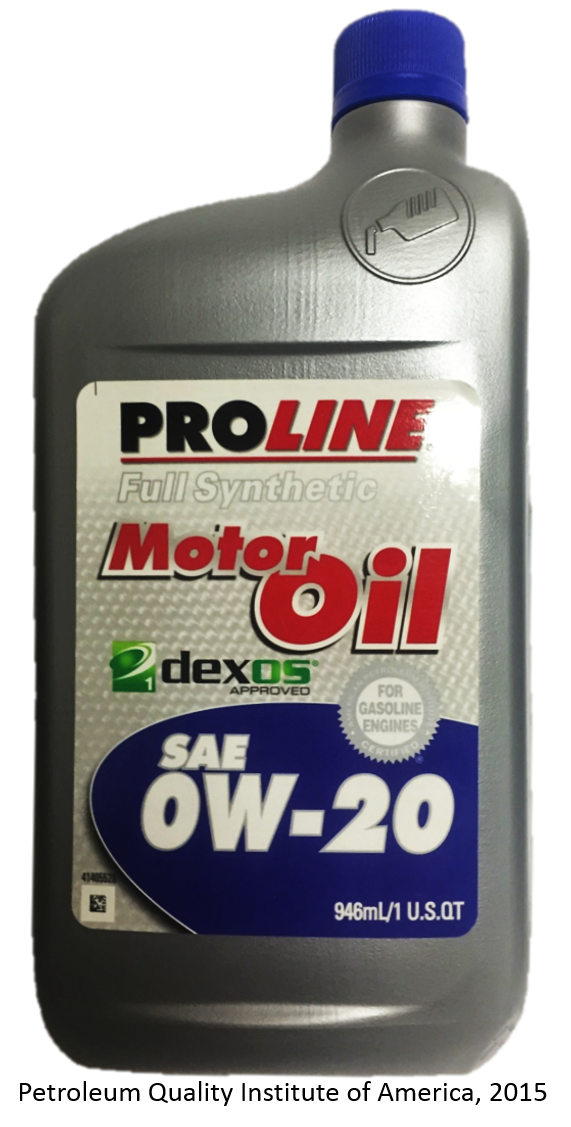
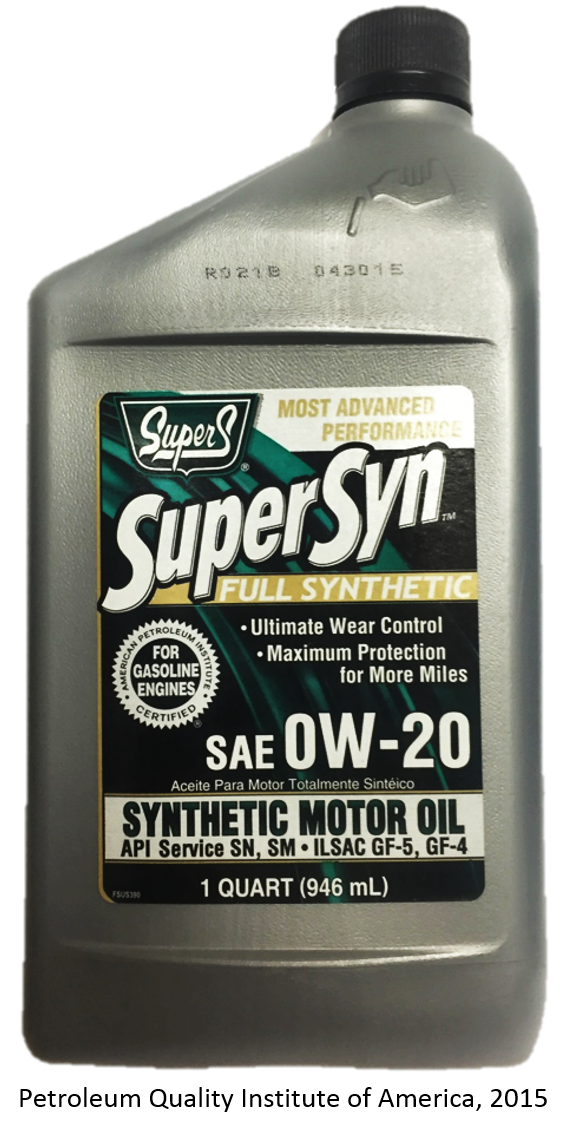
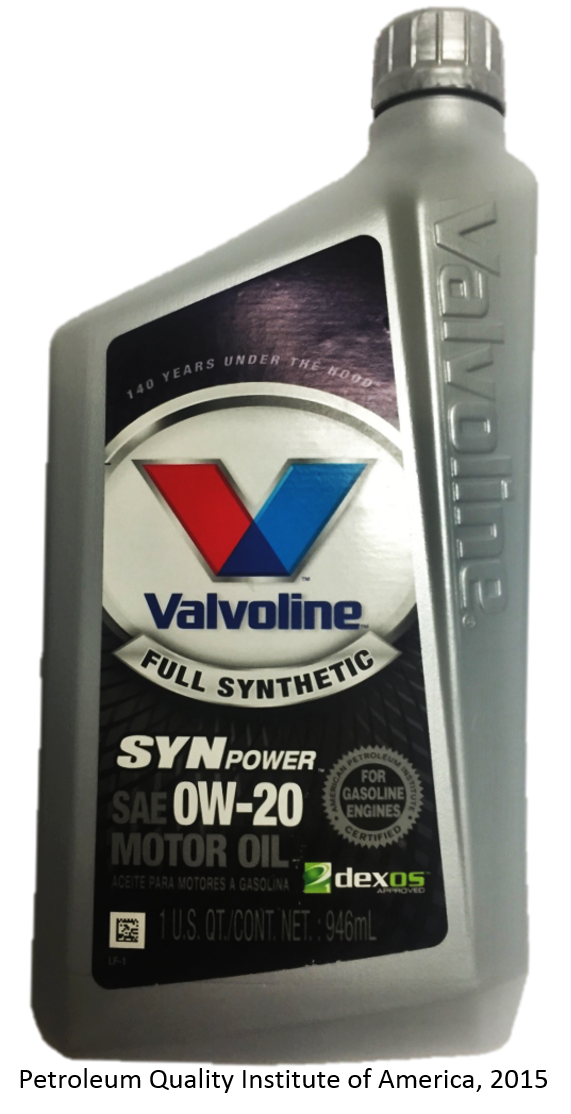
| Brand | AMSOIL | Castrol Edge | Mobil 1 | Pennzoil Platinum | ProLine | SuperS SuperSyn | Valvoline | |
| Listed American Petroleum Institute (API) Service Category | API SN ILSAC GF-5 |
API SN ILSAC GF-5 |
API SN ILSAC GF-5 |
API SN ILSAC GF-5 |
API SN ILSAC GF-5 |
API SN ILSAC GF-5 |
API SN ILSAC GF-5 |
|
| PHYSICAL TESTS (click test for details) | Standards(a) |
|||||||
| TBN, mg KOH/g,(ASTM D2896) | 7.84 | 8.55 | 9.21 | 8.88 | 8.04 | 8.1 | 8.77 | |
| Viscosity @ 100ºC, cSt, ASTM D445) for an SAE 0W-20 | 6.9 to <9.3 | 8.46 | 8.42 | 8.65 | 8.33 | 8.61 | 7.11 | 8.57 |
| Viscosity @ 40ºC, cSt, (ASTM D445) | 44.76 | 44.76 | 45.19 | 44.56 | 43.11 | 36.99 | 45.71 | |
| Viscosity Index (ASTM D2270) | 169 | 167 | 173 | 165 | 183 | 158 | 169 | |
| Viscosity @ -35ºC mPa s (cP) (ASTM D5293) | 6,200 Max | 5,723 | 5,537 | 3,928 | 6,068 | 5,786 | 5,006 | 5,721 |
| NOACK Volatility, mass % loss, 1 hr, @ 250ºC (ASTM D5800) | 15 Max (d) | 14.2 | 12.7 | 10.7 | 10.1 | 13.1 | 13.2 | 11.5 |
| ELEMENTAL ANALYSIS-b,c | ||||||||
| Additives | ||||||||
| Calcium, ppm | 2,142 | 2,295 | 1,094 | 2,615 | 2,190 | 2,195 | 2,168 | |
| Magnesium, ppm | 8 | 8 | 757 | 8 | 10 | 13 | 9 | |
| Phosphorus, ppm | 600 to 800 | 750 | 758 | 669 | 750 | 760 | 756 | 769 |
| Zinc, ppm | 826 | 817 | 709 | 835 | 814 | 813 | 828 | |
| Molybdenum, ppm | 83 | 82 | 79 | 57 | 78 | 85 | <1 | |
| Barium, ppm | <1 | <1 | <1 | <1 | <1 | <1 | <1 | |
| Boron, ppm | 246 | 384 | 99 | 3 | 234 | 223 | 2 | |
| Silicon, ppm | 3 | 4 | 6 | 7 | 5 | 4 | 4 | |
| Potassium, ppm | <5 | <5 | <5 | <5 | <5 | <5 | <5 | |
| Manganese, ppm | <1 | <1 | <1 | <1 | <1 | <1 | <1 | |
| Titanium, ppm | <1 | 7 | <1 | <1 | <1 | <1 | <1 | |
| Copper, ppm | <1 | <1 | <1 | <1 | <1 | <1 | <1 | |
| Sodium, ppm | <5 | <5 | <5 | <5 | 12 | <5 | 466 | |
| Vanadium, ppm | <1 | <1 | <1 | <1 | <1 | <1 | <1 | |
| Contaminants | ||||||||
| Silver, ppm | <1 | <1 | <1 | <1 | <1 | <1 | <1 | |
| Aluminum, ppm | 2 | 2 | 1 | 1 | 1 | 2 | <1 | |
| Chromium, ppm | <1 | <1 | <1 | <1 | <1 | <1 | <1 | |
| Iron, ppm | <1 | 1 | <1 | <1 | <1 | <1 | 1 | |
| Nickel, ppm | <1 | <1 | <1 | <1 | <1 | <1 | <1 | |
| Lead, ppm | <1 | <1 | <1 | <1 | <1 | <1 | <1 | |
| Antimony, ppm | <1 | <1 | <1 | <1 | <1 | <1 | <1 | |
| Tin, ppm | <1 | <1 | <1 | <1 | <1 | <1 | <1 | |
|
a- Standards, shown in yellow, are established by API, SAE and others. b-Test Method used for metal analysis is ASTM ASTM D5185. c- ASTM D5185-09 Reproducibility by Element. d- This specification is expressed to two significant figures, therefore results up to 15.5 are considered on specification for 0W-20s.
Copyright © 2016 Petroleum Quality Institute of America, LLC. |
||||||||